

![]()
E-Newsletter on Reforming Criminal Justices Responses to Battering
The Blueprint Bulletin provides you with tools to support your work. Each issue features information about Blueprint foundations, updates on Blueprint communities, and ideas about how to identify and address disparate outcomes.
Praxis can advise you on the adaptation and implementation of the Blueprint and/or to assist you in using aspects of the Blueprint response in your community. Access our Blueprint Clearinghouse to learn more about Blueprint training, consulting, information, strategies, and research.
Welcome Cache County, UT!
Numbers Tell Us Part of the Story
Resources Related to Data Collection
Contact Us
 Welcome Cache County, UT!
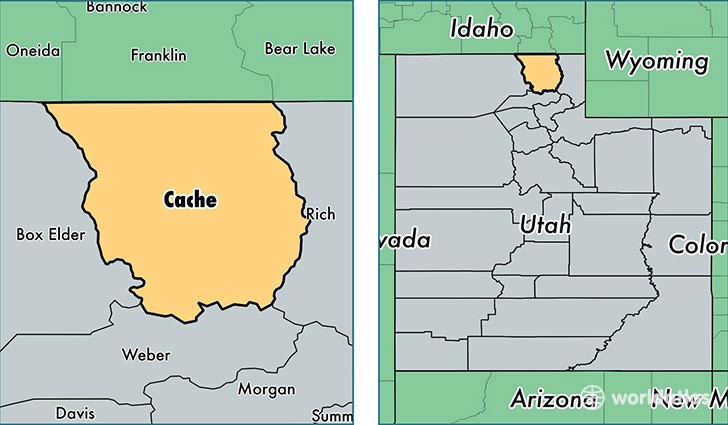 In 2018, The Community Abuse Prevention Services Agency (CAPSA) in Cache County, Utah received a grant from the Office on Violence Against Women Improving Criminal Justice Responses (ICJR) grant program to adapt and implement The Blueprint for Safety (Blueprint). Cache County is located in northern Utah and has a population of about 120,000 people; 50,000 of whom live in the county seat of Logan. The community has had an active coordinated community response for a number of years and decided to implement the Blueprint model to reinvigorate and strengthen their work. They are off to a great start, having hired a Blueprint coordinator, convened a Blueprint adaptation team, and begun mapping their community’s law enforcement response to domestic violence crimes.
Welcome to the Blueprint community Cache County!
Numbers Tell Us Part of the Story
Not everything that counts can be counted, and not everything that can be counted counts. – Albert Einstein
Albert Einstein, brilliant mathematician and physicist, cautions us against an over-reliance on numbers to tell a complete story. Data is often thought of narrowly, as representing only numbers or what can be counted. But Blueprint communities need to think broadly about sources of data – recognizing that multiple ways of knowing are essential to drawing a full picture of the nature and scope of intimate partner violence. Other sources of knowledge include:
- survivors’ accounts of how community institutions have responded to their needs;
- knowledge, experiences, and perspectives on criminal justice responses of organizations or individuals working with marginalized people and/or communities;
- mapping the steps in case processing;
- talking with and observing practitioners at work; and
- analyzing the extent to which policies and practices reflect best practice or produce negative outcomes.
Numbers, however, do tell part of the story. Blueprint communities need to access statistical data from criminal legal system agencies to understand and articulate how the system is doing. Counting data points related to the criminal legal system—such as the number of calls to 911, misdemeanor arrests, cases charged or convictions obtained—contributes to a deeper understanding of the community’s response to domestic violence. Comparing those data points to general demographic data can lead to important questions, such as: Who is getting arrested in our community and who is not? Are we arresting victims for defending themselves? To what extent does criminal legal intervention fall disproportionately on people of color/Native people, people living in poverty, immigrants or other marginalized groups?
Accessing this data can be challenging, and it can be difficult to accurately interpret what is available. It is still important to try to answer such questions in order to work toward greater accuracy and understanding of the meaning of the data over time.
- Demographics, such as:
- Population size
- Race/Ethnicity of Population
- Gender distribution
- Age distribution
- Income levels/socio-economic status
- Nationalities represented among:
- permanent residents
- asylees or refugees
- individuals with non-immigrant visas
- Languages spoken
- Interpretation resources available among agencies?
- People with disabilities in the community
- People who are Deaf and/or hard of hearing
- LGBQ people in the community
- Transgender people in the community
- System generated data, such as:
- Number of crisis line calls or requests for advocacy services or shelter
- Number of 911 domestic violence-related emergency calls
- Number of protection orders filed
- Number of arrests on domestic-violence related charges
- Number of times language services were accessed
- Prosecution charges and disposition
- Race and gender of those arrested and prosecuted
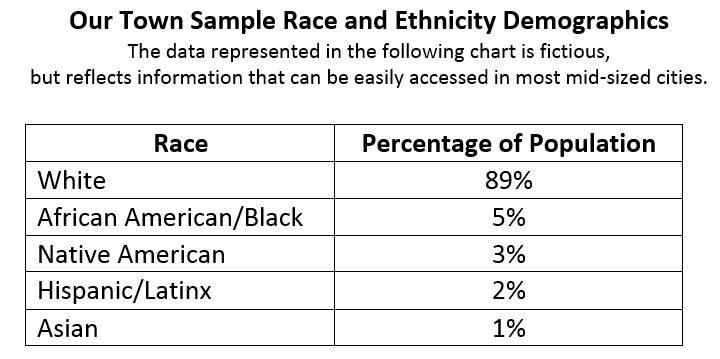
Our Town Sample Race and Ethnicity Demographic, The data represented in the following chart is fictitious, but reflects information that can be easily access in most mid-sized cities.
A quick glance at the sample data charts reveals that people of color are arrested and prosecuted at rates far beyond their representation in the population, a phenomenon that is all too common around the country. This chart also demonstrates that charging and conviction rates fall disproportionately on women and people of color across the board. A close examination of the data charts, such as those above, may bring to light other potential problems that warrant further analysis.
However, while the above chart includes information that is often fairly easy to access, it does not tell the complete story of a community’s response to domestic violence cases. For example, it does not tell us anything about cases involving same-sex partners; or include the experience of transgender and/or non-binary individuals, those with limited English proficiency, immigrants, people living in poverty, or other marginalized people. This information is often harder to find but failing to look for it contributes to the invisibility of people who are often pushed to the margins of the community.
Basic numerical data such as what we see above can be mined to help the Blueprint team identify and focus on potential problematic practices. Supplementing the numbers with the lived experiences of those who are harmed can add crucial detail and texture to the picture. Gathering this kind of information during the early stages of Blueprint development can also provide a snapshot of the community’s criminal justice response which will serve as an essential baseline for later comparison.
Here are a few ways to begin collecting numerical data:
- Look at census data for the community.
- Ask local law enforcement agencies to share reports they have made to the FBI’s Criminal Justice Information System (CJIS).
- Gather police reports and court records.
- Analyze court observations conducted by the domestic violence program or court watch.
- Use a database that tracks cases as they progress through the system such as the Domestic Abuse Intervention Network.
- Track data about victims’ experiences with the criminal legal system, specifically regarding criminal case outcomes (see Institutional Response Concerns Procedure).
For more information on data collection and other ways to uncover the scope and scale of domestic violence in a community, see the Blueprint Guide-Appendix 22: Policy and Practice Assessment Guide , specifically pp. 14-27.
Resources related to data collection
Community Consultation in the Blueprint for Safety
One of the Blueprint’s distinctive features is the model’s commitment to grounding the approach and process in the experiences of victims of battering. Actions by the criminal legal system affect victims in different ways, sometimes with unintended harmful impacts. To keep victims of battering at the center of the Blueprint requires talking with survivors and others in the community as a matter of routine practice. In other words, community consultation must be a regular, sustained way of doing the business of the Blueprint. This resource summarizes strategies for community consultation in Blueprint communities.
The Blueprint Policy and Practice Assessment Guide
The Blueprint Policy and Practice Assessment Guide is a supplement to Becoming a Blueprint Community: A New Response to Battering and Domestic Violence Crimes Response to Battering and Domestic Violence Crimes. The material included in the Policy and Practice Assessment Guide provide basic information that positions a Blueprint coordinator and team to answer critical questions such as:
- How does the current criminal legal system response meet the Blueprint’s essential elements for recommended practice in battering and domestic violence related crimes?
- What are the range of victims’ needs and experiences with the current response?
- What are the experiences of victims from communities that are over-represented and/or underserved in the criminal legal system?
- What policy and practice changes should be made to address gaps in recommended practice and better meet victims’ needs within the framework of the Blueprint for Safety?
Contact us for more information
Blueprint for Safety Team
info@praxisinternational.org
This project was supported by Grant No. 2015-TA-AX-K032 awarded by the Office on Violence Against Women, U.S. Department of Justice. The opinions, findings, conclusions and recommendations expressed here are those of the author(s) and do not necessarily reflect the views of the U.S. Department of Justice.